 HackerTube.runGood videos, with context.
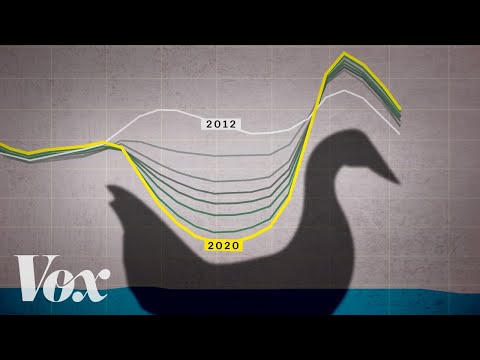
The 'duck curve' is solar energy's greatest challenge
About this video
A short Vox explainer on the duck curve, the shape electricity demand takes in California as solar output grows. It explains why grid operators struggle to balance supply and demand with lots of solar.
Why it appears in the archive
Cited as a quick explainer in threads about rooftop solar, renewables, and grid load.
AI-generated summary and labels from the source dataset; verify important details against the video. Source & credits.
From the Hacker News discussion
VOX just released a video on the "Duck Curve" phenomenon that arises as a result of renewables[1]. Does anyone here have any insight on what the state is trying to do to mitigate negative downstream affects of the duck curve? [1] [VIDEO]
Read original comment ↗That's because solar usage has created a "duck curve" I would imagine it would be even more unfair to make normal energy users pay for that: [VIDEO]
Read original comment ↗It's not so much that they can wind down the energy they make, it's the fact that they cannot store energy for when there's increased demand. [VIDEO]
Read original comment ↗